
Introduction
These three case studies illustrate, through three concrete examples, the operational value of digital simulation for a district heating network:
- Finding where a network can expand without risk
- Checking hydraulic safety margins before starting work
- Optimising the start-up order of production plants
In each case, the goal is the same: turning a complex technical question into a clear, quantified and defensible decision.
1. Finding the spare power capacity available in a network
The context: an operator or local authority considering connecting new customers, or extending its network into a new district, needs to know — before making any financial commitment — whether the existing network can absorb this extra load, and above all where.
Digital simulation of the network calculates, for every pipe section, the relative spare capacity against its rated capacity.
✳
Turns a qualitative question (« can the network be extended? ») into a quantified, area-by-area answer.
✳
Avoids unnecessary investment: no need to reinforce a pipe that actually still has headroom.
✳
Secures genuinely constrained areas, by pinpointing exactly where reinforcement is needed.
✳
Speeds up decision-making: the capacity map becomes a direct discussion tool with local officials, developers or future customers.
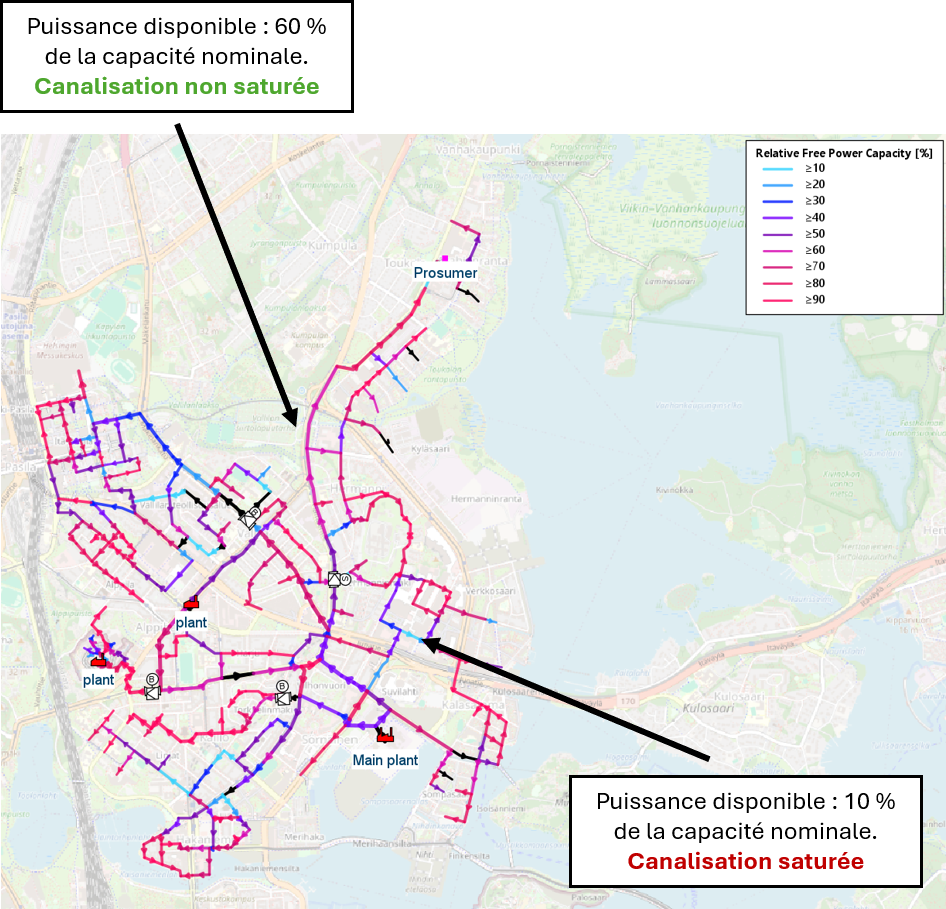
In short, this study makes it possible to answer, within hours, the question: where exactly can my network grow today, and where does it need reinforcing first?
2. Checking pressure margins before extending a PN16 network
The context: district heating pipework is rated for a maximum service pressure, commonly the PN16 (16 bar) standard. Before raising the setpoint pressure, adding a more powerful pump, or extending the network, it is essential to check that the maximum pressure reached anywhere in the network stays below this limit, with a sufficient safety margin.
Dynamic hydraulic simulation calculates pressure at every node of the network, under the most unfavourable operating conditions. In the example shown, the most stressed point reaches 7.1 bar, against a PN16 limit of 16 bar: a comfortable margin of 8.9 bar, allowing the network to be extended with no pipe replacement at all.
✳
Avoids costly, unnecessary pipe replacement, by showing that the existing safety margin is sufficient.
✳
Secures projects where the margin is insufficient, by identifying upfront which sections need reinforcing before work starts.
✳
Provides a quantified technical justification, usable with a certification body, an insurer or a local authority.
✳
Makes it possible to plan reinforcement needs several years ahead, by simulating different development scenarios.
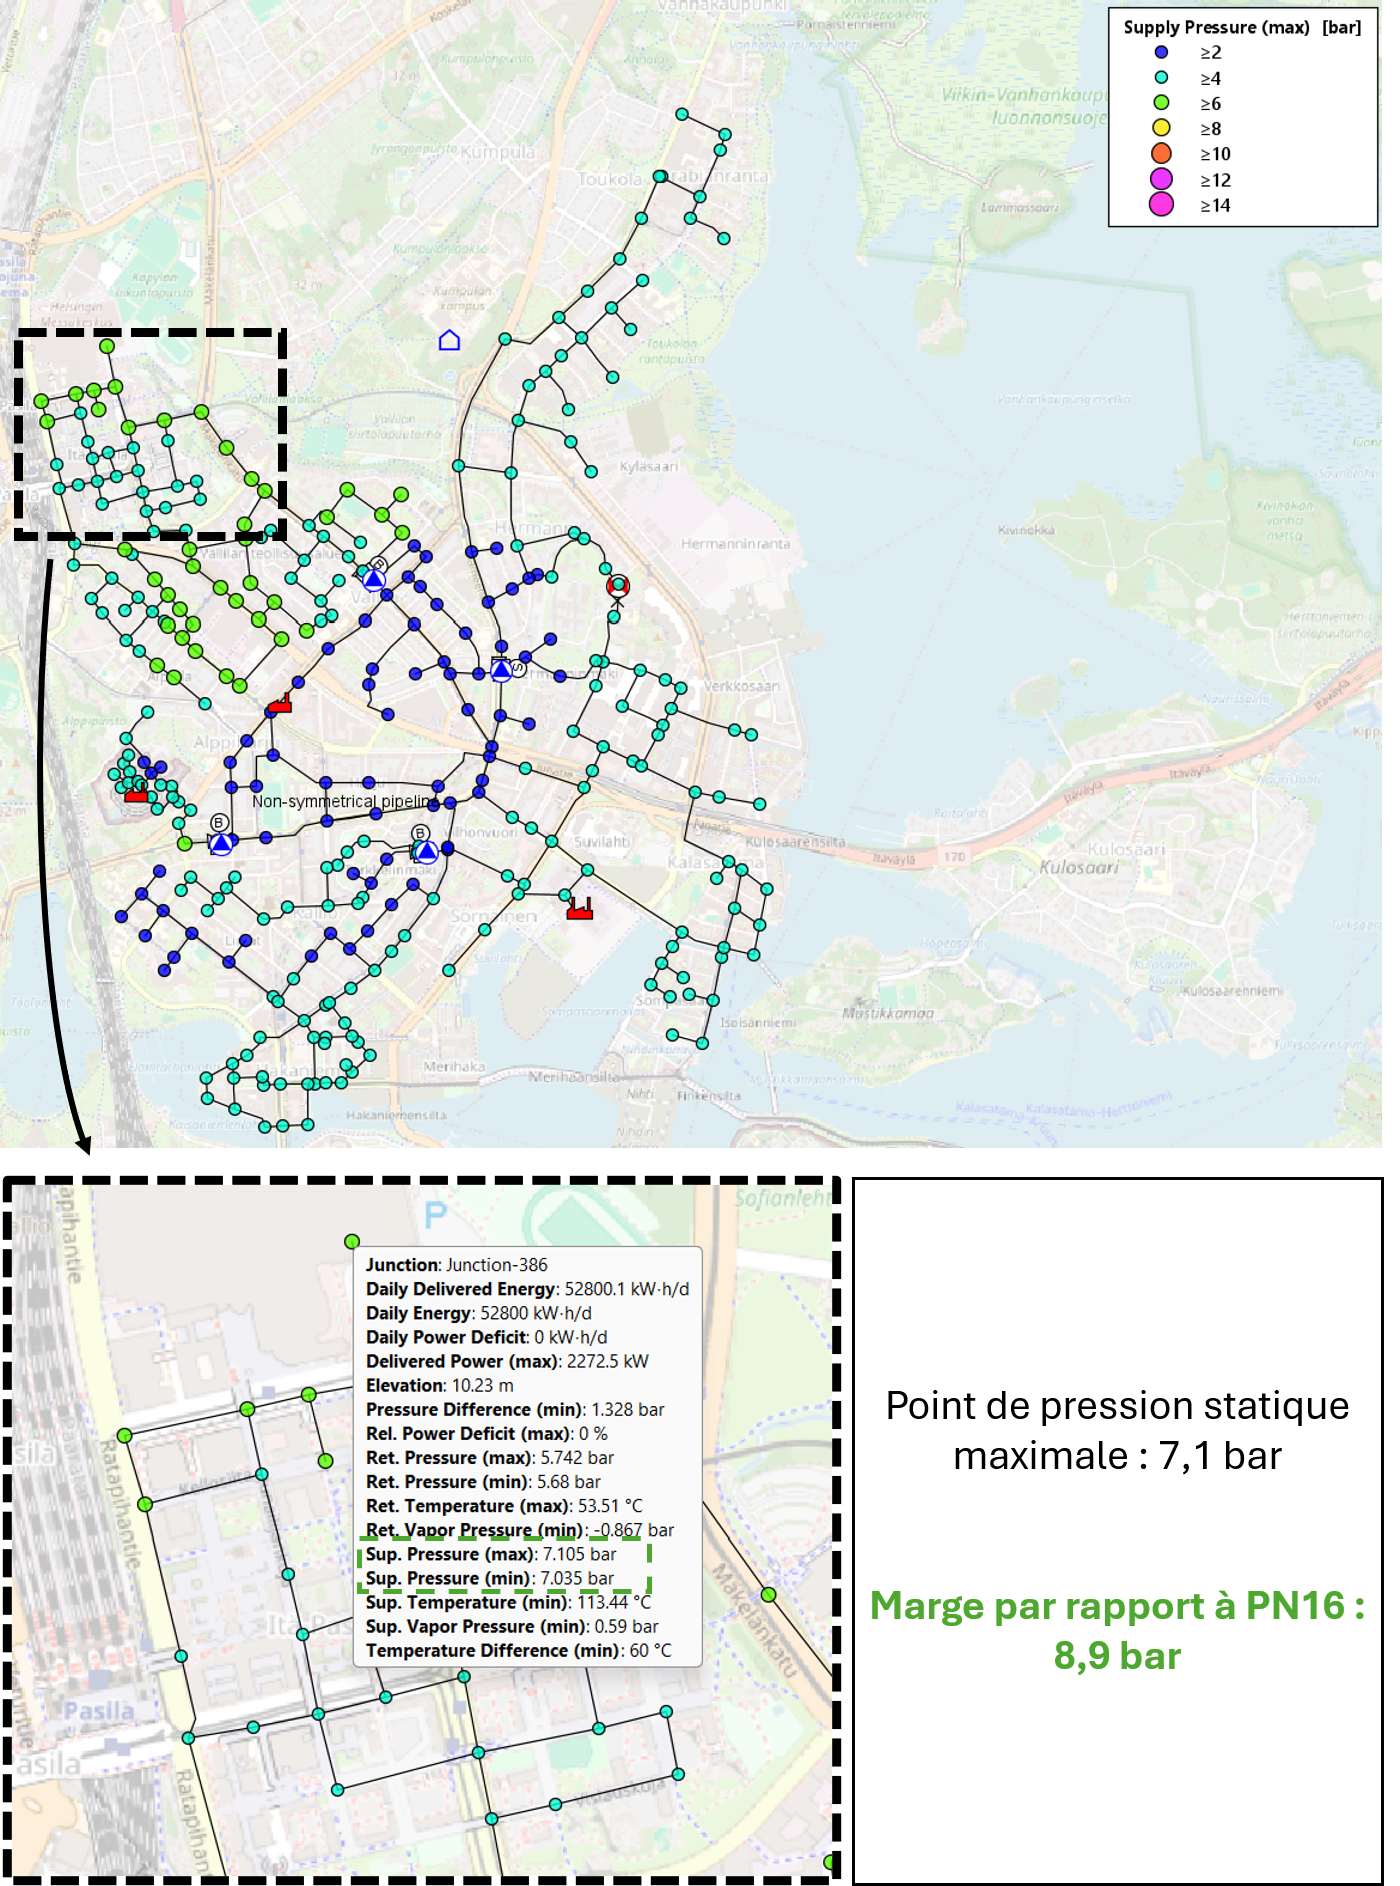
This study turns a regulatory and technical constraint into a decision-making tool: it clearly shows what is possible without any work, and what requires a targeted investment.
3. Optimising the start-up order of production plants (merit order)
The context: a multi-source district heating network generally has several production units with very different characteristics. Examples include: an energy-from-waste plant (incineration), a biomass boiler, and one or more gas boilers for backup and peak loads. The merit order question is about deciding, at every moment, which plant should be running, and in what order, to meet demand at the lowest cost while respecting the technical constraints of each unit.
Digital simulation makes it possible to test every cascade scenario and validate, for each one, its actual hydraulic feasibility on the network. In the example shown, the chosen cascade prioritises incineration up to its maximum output, then biomass as a complement, and finally gas, used only at peak times.
✳
Maximises the share of renewable and recovered energy in the production mix, keeping gas for peaks only.
✳
Minimises the network’s overall operating cost, by optimising the dispatch order based on marginal cost.
✳
Ensures the chosen cascade is realistic and workable, hydraulically validated before it is put into practice.
✳
Provides a basis for discussion with the awarding authorities on the network’s renewable energy share targets.
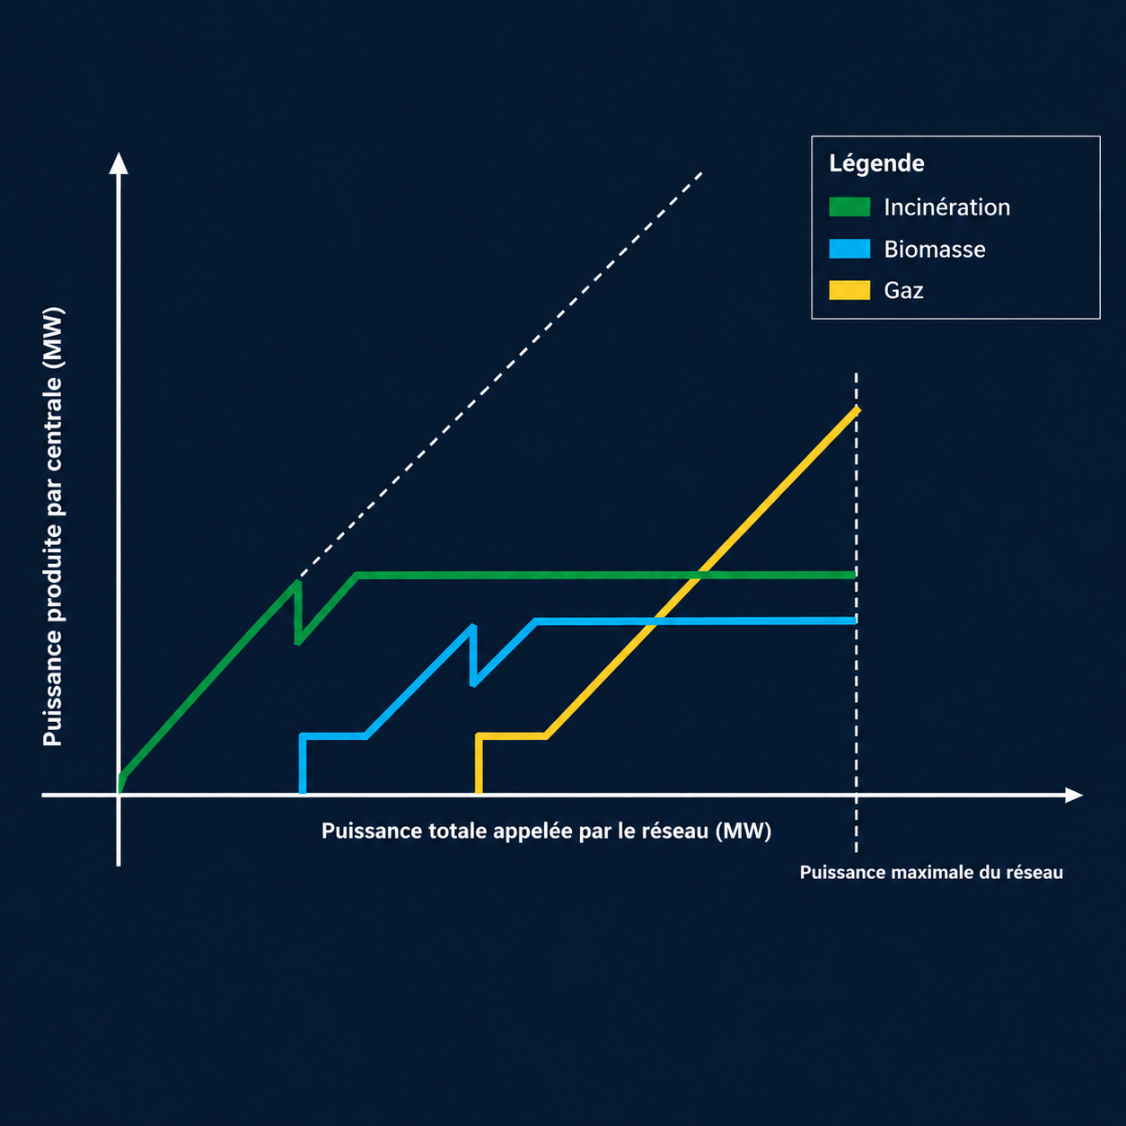
This study illustrates the complementarity between economic optimisation and technical validation: a merit order is only worth anything if it can actually be run on the ground, and that is exactly what simulation verifies.